Data Structures & Algorithms in Python
Data Structures & Algorithms in Python
Press the ▶ Run buttton below to see the data structure and algorithm visualizations in action. See the notes about the limitations of running the visualizations in a browser. The GitHub JMCanning78/datastructures-visualization repository has the source code for all the visualzations.
There are limitations on viewing the visualizations in a web browser. We use Trinket to run the Python programs on a server and then copy the display into this web browser. The main limitations are:
The visualizations are small programs that usually show one data structure at a time. They all have a similar structure with a drawing area at the top and a set of controls on the bottom, as in the example below. There are specific instructions for how to use the visualizations in the book's chapters, and some general guidelines common to all of them follow.
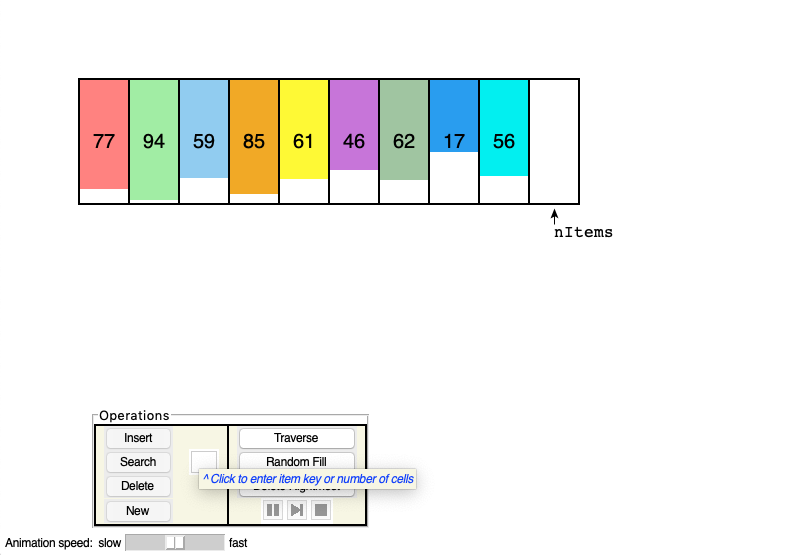
The visualizations show the data in a drawing area at the top. The Operations box in the lower left is where you initiate operations on the data structure. The buttons are grayed out and disabled when they are not applicable. In particular, the operations that take an argument like a key to insert are on the left side of the Operations box. They are grouped with a text entry area that must have a value entered before they become enabled. The hints in blue text explain what can be typed in the text entry area for the different operation arguments. Operations that take no arguments, like Traverse and Random Fill, are on the right.
Below the Operations box is a slider. This control can be
adjusted to slow down or speed up the animation of the
operations. During animations, the three small buttons on
the lower right


 are enabled to provide fine control.
The leftmost of three buttons is either a triangle
are enabled to provide fine control.
The leftmost of three buttons is either a triangle
 to resume playback, or two vertical bars
to pause the animation, depending on the current state.
The second button
steps forward in the animation by one "step."
That button is enabled only when code is displayed because
the steps are defined by the code.
The square button
stops the current operation and enables
other operations to be run.
Stopping an operation before it finishes can leave the data
structure in an odd state, such as leaving extra copies
of data items or not sorting all the items.
to resume playback, or two vertical bars
to pause the animation, depending on the current state.
The second button
steps forward in the animation by one "step."
That button is enabled only when code is displayed because
the steps are defined by the code.
The square button
stops the current operation and enables
other operations to be run.
Stopping an operation before it finishes can leave the data
structure in an odd state, such as leaving extra copies
of data items or not sorting all the items.
During most operations, a code box appears in the lower right.
It shows the same program described in the book,
highlighting the part of the program being executed.
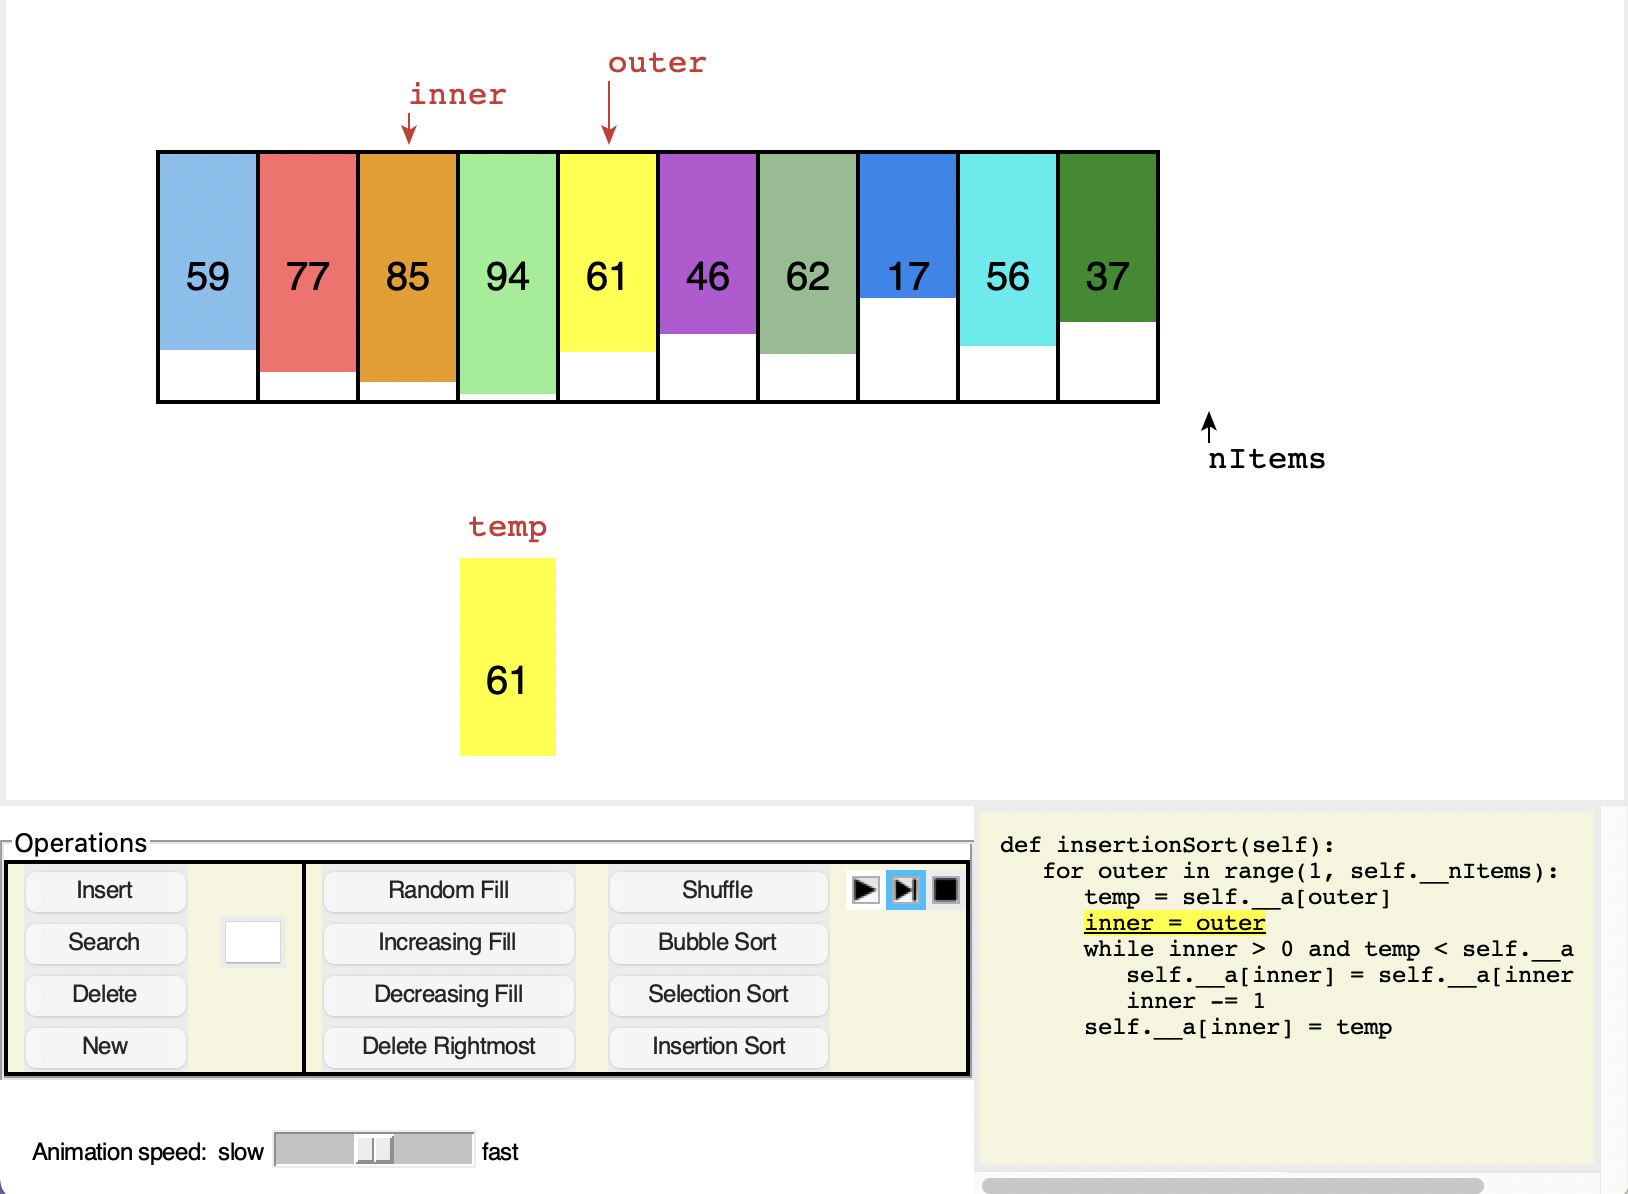 In the figure above, the items in an array are being sorted. The
various local variables are shown along with the data
structure in the drawing at the top. Only the three
animation buttons are enabled while the sort operation
runs. The highlighting around the single step button
indicates that keyboard focus is on that button. Pressing
the spacebar when a button has keyboard focus "presses"
the button. Operations normally begin running in the
"play" mode when a button is pressed. By holding down the
Shift key when pressing the button, you can start the
operation in stepping mode (if it displays code).
In the figure above, the items in an array are being sorted. The
various local variables are shown along with the data
structure in the drawing at the top. Only the three
animation buttons are enabled while the sort operation
runs. The highlighting around the single step button
indicates that keyboard focus is on that button. Pressing
the spacebar when a button has keyboard focus "presses"
the button. Operations normally begin running in the
"play" mode when a button is pressed. By holding down the
Shift key when pressing the button, you can start the
operation in stepping mode (if it displays code).
After each operation finishes, the code and local variables remain on the display until the next operation is started. Status or error messages can appear at the bottom of the window, between the sliding speed control and the code box. The messages usually appear when operations finish.
In most visualizations, you can click a data item to select it and copy its value into the text entry area. This makes it less likely that a typographical error will prevent searching for or deleting an existing value.
Hint messages about the controls can appear next to the text entry box(es) and operations buttons. Hovering the mouse pointer over one of them displays a short hint about what values can be entered in that box or what the button does. When you first start one of the visualizations, it displays a message telling you all the kinds of things that can be entered in all the text entry box(es).
Depending on how you run the visualization, you may be able to resize the window. This capability is sometimes useful when the amount of data grows too large or the lines of code are wide. The code text box does not grow vertically but can be scrolled for longer programs. Some visualizations require more display space and provide scrollbars to move around. At least one visualization also lets users zoom in and out on particular regions.